Representation
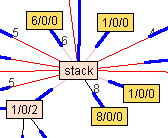
These graphs represent the relationship among runtime data structures.
They are snapshots of single points in execution time.
Most of the nodes represent an allocated block of memory. Additionally,
there is one node for the stack, and another for static data (globals).
The edges represent pointers. The thin red end is at the object containing
the pointer, the thick blue end is the object pointed-at.

In the above image, there are six nodes. Five are allocated objects, and the
stack node is present. There are several edges shown. For example, there is
a single pointer from the stack to the object in the upper-right.
Moving Nodes
Left-drag to move a node.
Right-click, while left-dragging, to toggle whether a node moves on its
own or stays put.
Stack Trace
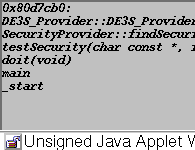
When the applet is started, a tiny window appears in the upper-left of the
screen. Resize this window to see its contents. Initially, it contains
the in-degree histogram. Left-click on a node to see the stack trace at
the time the node was allocated.

Checkboxes
- Stress: When checked, some edges have a number next to them, indicating how
many edges are piled on top of one another. In the example picture above,
there are six edges from the stack to the node in the upper-left.
- Relax: When checked, nodes move around according to some artificial "physics".
Note -- when this is not checked, the applet does not automatically
redraw (this is a bug, essentially).
- Hide 0x...: When checked, nodes are shown without addresses.
- Froms: When checked, nodes are displayed with numbers on them, indicating how
many pointers point at the object, and from where. The format is:
from-stack/from-data/from-heap (from-self).
The last value (from-self) is only shown when it is nonzero.
Buttons
- Hist: Press this to display the in-degree histogram in the stack trace window.
Text Fields
By putting numeric values in the text fields, nodes with matching in-degree
statistics can be highlighted. For example, if the third field is set to "1",
for a final statistic of 0/0/1(0), all nodes with this statistic will be
highlighted (in this case, that's over 80% of them).
